PhiFlow
ΦFlow Web Interface
ΦFlow provides an interactive web interface that can display 1D, 2D and 3D data. This GUI uses Dash to host a website on a local port. Opening the website remotely may require port forwarding, e.g. via SSH.
The Dash GUI is the default user interface for python modules, i.e. when running a .py file as the main module.
It can be specifically selected by setting gui='dash' in view() or show().
Tabs & Features
The web interface consists of multiple tabs (web pages) which can be accessed at the upper left corner of each page.
- Home shows the title and description of the app. It allows the user to choose one field to view and to start/pause the app or step a single frame. Additionally all app-specific controls are shown at the bottom.
- Side-by-Side is similar to Home but shows two fields at a time instead of one.
- Info displays additional information about the current session such as file paths and run time.
- Log displays the complete application log.
- Φ Board contains benchmarking functionality. For TensorFlow apps it also allows the user to launch TensorBoard and run the TensorFlow profiler.
- Help refers to this page.
Tips & Tricks:
- You can run a specified number of frames by entering the number in the text box next to the ‘Step’ button. If you put a ‘*’ before the number, it is multiplied by the app’s
stridevalue which can be found in theinfotab.
Frame Rate and Refresh Rate
The web interface provides a Refresh rate control above the field viewer.
This value describes how often the diagrams in the browser are updated.
It is independent of the framerate specified in view() which defines how quickly the user code is executed.
Configuration
The show method supports additional keyword arguments to configure how the App contents are displayed.
The display parameter defines which fields are displayed initially, e.g. display='Density' or display=('Density', 'Velocity').
Further configuration parameters
| Parameter | Description | Default |
|---|---|---|
| external_web_server | Whether an external tool is used to host the Dash server. If False, launches a new web server. | False |
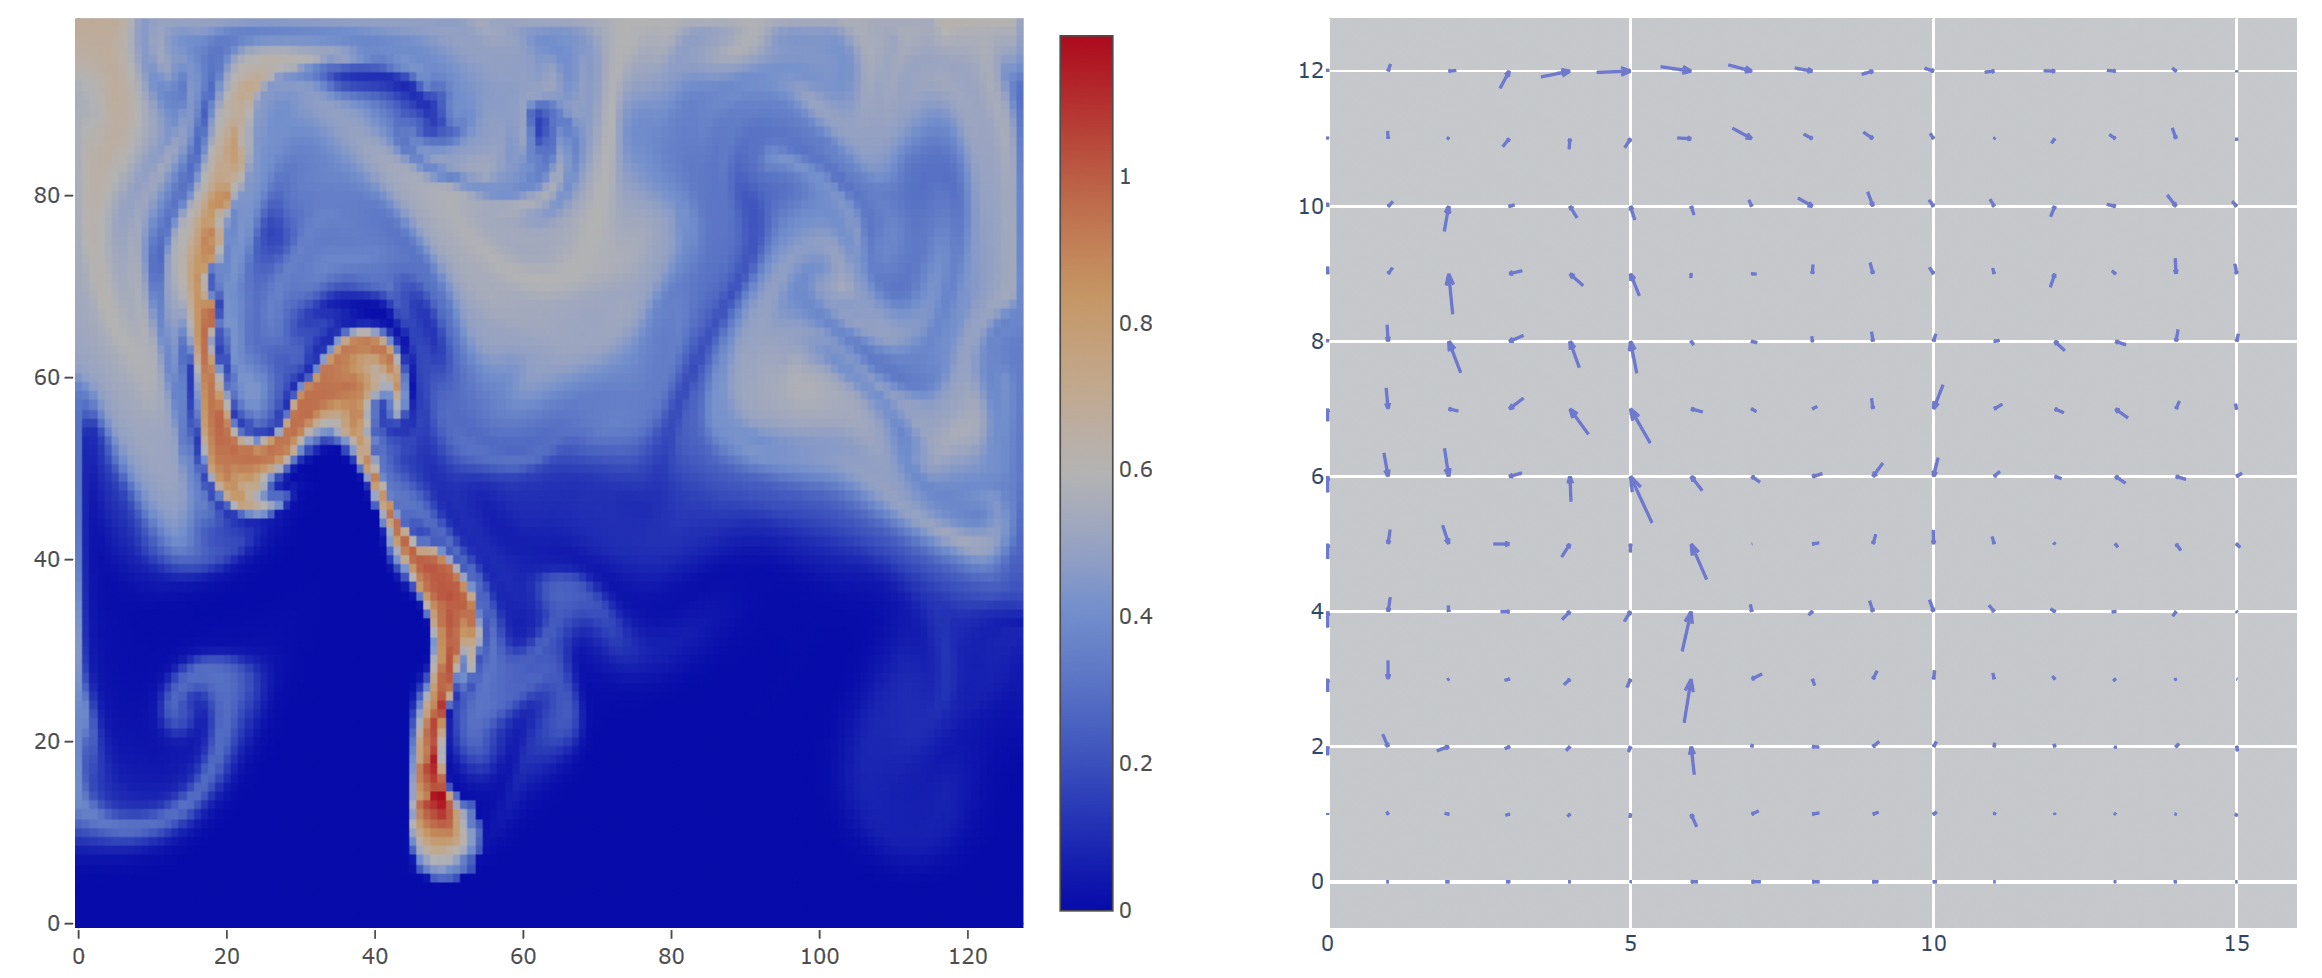
| arrow_origin | Which part of the arrow is centered at the position of the field. One of ‘base’, ‘center’, ‘tip’. | ‘tip’ |
| max_arrow_resolution | Downscale grids to have no more than resolution**2 cells before drawing arrows. | 40 |
| min_arrow_length | Fraction of figure size. Smaller arrows are not drawn. | 0.005 |
| max_arrows | Maximum number of arrows to draw. Arrows are sorted by length. | 2000 |
| draw_full_arrows | Whether to draw the tips of arrows. If False, draws arrows as lines. | False |
| colormap | Built-in: ‘viridisx’, ‘OrWhBl’. Additional colormaps can be used if matplotlib is installed. | ‘viridisx’ |
| slow_colorbar | If True, keeps colorbar similar to previous frame if possible. | False |